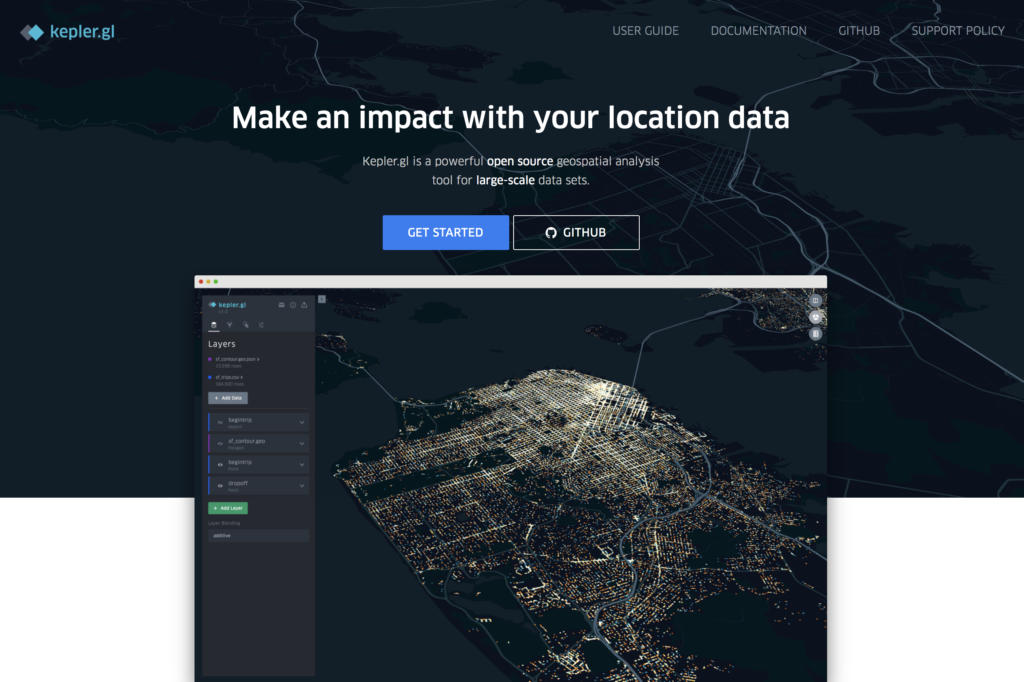
Kepler.gl is a powerful open source geospatial analysis tool for large-scale data sets. In plain english it lets you visualize data by mapping multiple location points and letting the user use both time and distance as a means to tell a story. The system is designed for both technical and non-technical users. The key is to learn how to use the available filters to visualize the insights that you what users to explore.
The Kepler.gl workflow is based on data layers that permit the creator to present a variety of visualizations including “points”, “lines”, “arcs” and even a “heatmap”. Kepler provides a variety of map styles, color palettes, and map settings. Like most well thought out applications, users need to only spend a little time getting familiar with the interface. It is highly recommended to start with a small project to get better acquainted with Kepler’s unique and very useful features.
For my class assignment we used mapping data collected during the 1930s Works Progress Administration (WPA) Slave Narrative Collection. From 1936 to 1938 the Federal Writers’ Project undertook a major initiative to compile the histories of former slaves living in seventeen states. I was able to use data gathered in the state of Alabama. The map data displayed below shows the relationship of where the subject was interviewed and where they were originally enslaved.
Recent technologies like Kepler Gl. will provide researchers a whole new way of using maps to visualize large collections. The fact that I was able to bring alive dormant data that had been stored somewhere for over 70 years is impressive. But the key to a successful project will be obtaining consistent and accurate mapping data.