Categories
Digital Humanities social media strategy

Developing a Social Media Strategy for the “Mapping the Civil War in Arlington” Project

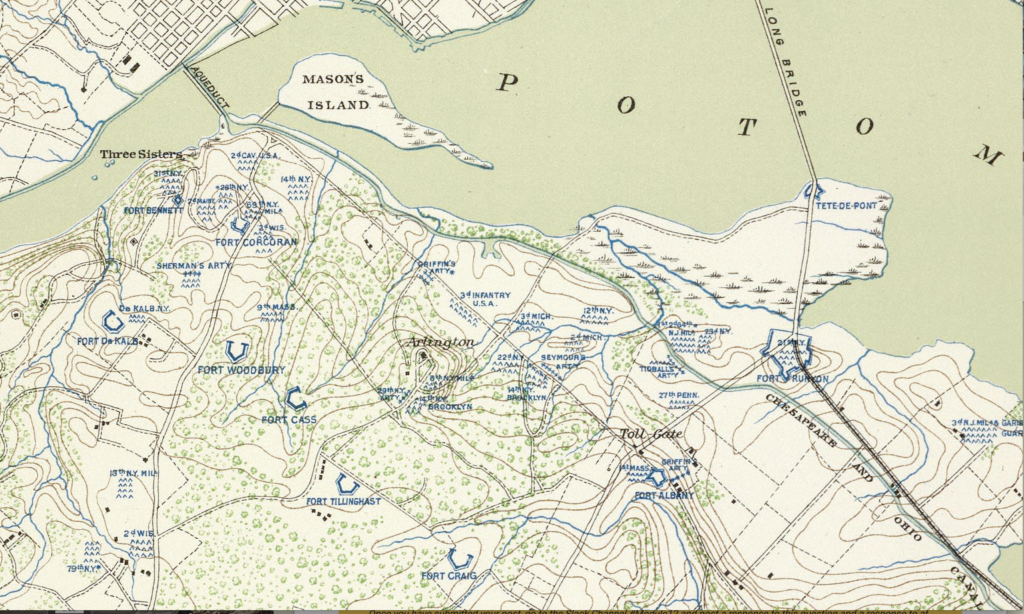
During the first few months of the Civil War, Brigadier General Irvin McDowell ordered a topographical survey of Union forces and defenses in Northern Virginia. The survey led to the creation of a detailed map that shows the locations of forts and regimental camps. Almost 160 years old, the “Map of the Ground Occupation and Defense of the Division of the U.S. Army in Virginia” is a visual reminder of the tens of thousands of Union troops that once occupied Arlington County.

The McDowell survey is part of a broader digital humanities project to use historic maps to plot the location of these forgotten sites on a contemporary and online map. While the location of the forts are well known, the challenge is trying to identify the precise GIS coordinates of the camps. The goal of “Mapping the Civil War in Arlington” is to provide an educational resource for three primary audiences. These include: 1) fourth grade teachers and students in Arlington County, 2) Civil War historians, and 3) local neighborhood associations.

In the state of Virginia, the topic of the Civil War is introduced to elementary students in the 4th grade. “Mapping the Civil War” brings history closer to home for these students. Plotting the locations of Union camps on a modern map using applications like Keppler.gl, will help students to literally discover the history in their backyards. Teachers will be able to use the GIS data to create visual timelines and track how the Union Army grew in size.

For Civil War historians, “Mapping the Civil War” makes accessible a new collection of data that focuses on a relatively unknown historical period. From May to October 1861, Arlington was the front line between Union and Confederate forces. A comprehensive overview of the location of the regimental camps, forts, and military engagements provides a different narrative. These northern regiments, were untested, poorly trained, and experiencing the south for the first time. Many of the Union Army’s future military heroes , like William Tecumseh Sherman, were still not battle tested.

Finally, neighborhood associations in Arlington are very active in historic preservation. “Mapping the Civil War” provides these associations with a new historic perspective. Residents will be able to look online and see who camped in their backyards.

In order to reach teachers, students, historians, and local residents, “Mapping the Civil War” requires a well defined social media strategy. Since the project has a wide audience, it will require the use of several different social media platforms and tools. At the core of the strategy will be the use of a website that will host the online mapping tool. The site will also provide teacher guides and proposed learning activities for students.

The strategy will also include a blog that will provide a location for historians to review update research and engage one an other. The project blog should be updated frequently. In addition, the project should utilize YouTube and Instagram to encourage project contribution by generating “then and now” videos. The goal would be to get students to go visit sites near their elementary school and integrate historic photos with contemporary video.

In regard to the project’s overall message, Civil War history is going through a 21st century revision. As a southern state, Virginia traditionally looked back at the Civil War through a “Lost Cause” filter. But “Mapping the Civil War” provides a new narrative that highlights Arlington’s role in saving the Union, freeing the slaves, and the creation of the Army of the Potomac.

During the first year of the Civil War Arlington was host to tens of thousands of young, inexperienced soldiers from all over the north. These men spent months in Arlington learning how to fight and eventually win the war. Many of the soldiers wrote letters to family back home and kept diaries about their experiences in Arlington and life in the army.

The project networks the digital collections of these first hand accounts with where the soldiers camped. This provides students in Arlington an opportunity to personalize and connect with their local history.
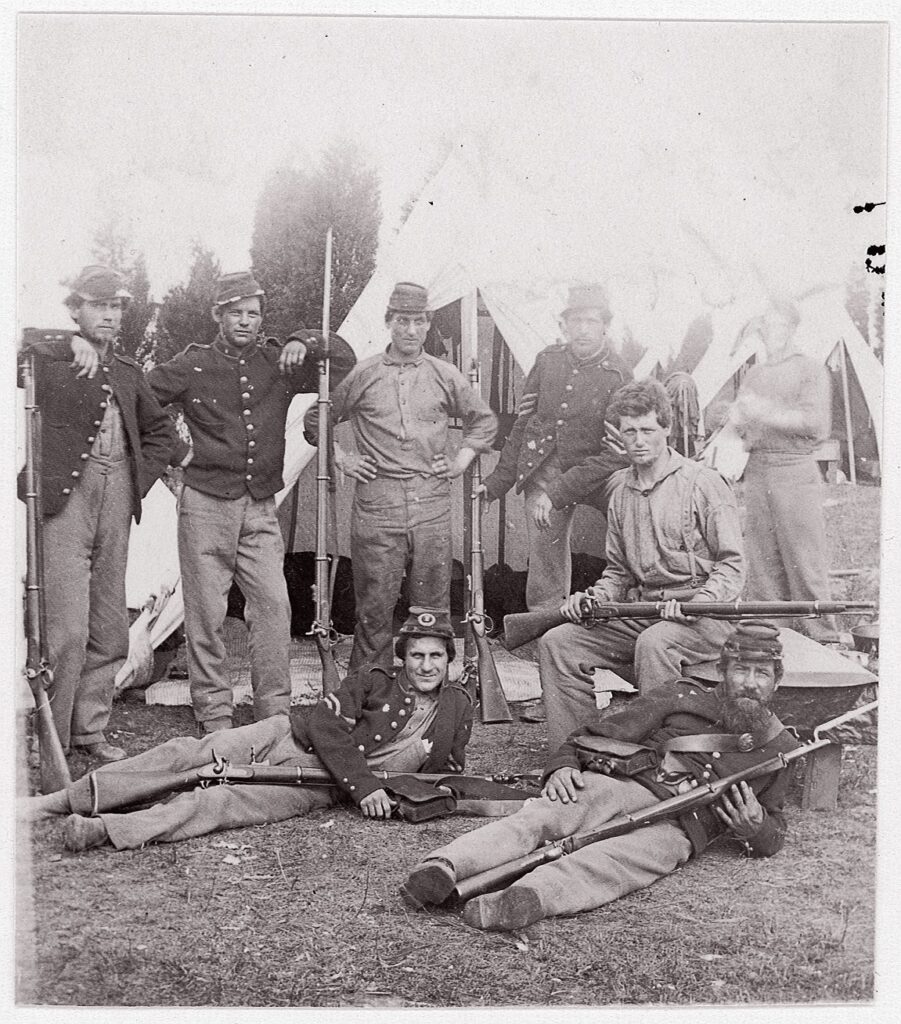
Soldiers of the 23rd New York

Another goal is to engage with a large group of Civil War historians and researchers. This period of Civil War history has often been overlooked. The project is not only about mapping the physical location of the Union regiments, but tracking their activities later in the war. Enabling and leveraging crowdsourcing will shed light on new historical perspectives.

Finally, utilizing Facebook, the project can engage and assist local neighborhood associations with future preservation projects. For example, as part of the “Lost Cause” legacy, many Arlington street names still favor Confederate generals. It would be interesting if the project could encourage and support the renaming of some of these streets with Union officers like General Sherman.

As part of the social media strategy the project will identify some “SMART” goals. These will include specific, measurable, realistic, and time-bound goals. For example, the success of the Facebook strategy will be determined by how many of the neighborhood association sites promote the project. The website and blog statistics will also provide a benchmark for tracking audience growth and an opportunity to respond to comments and questions. The posting of YouTube and Instagram videos and photographs will provide a significant measurement of how well the project is engaging with the local schools. A final measurement of success will be to track and identify other social as well as traditional media responses to the story.

Categories
crowdsource Digital Humanities digitization

Using Crowdsourcing for Digitization

Mark Twain’s Tom Sawyer getting help to whitewash Aunt Polly’s picket fence.

In his book, “The Adventures of Tom Sawyer,” Mark Twain (Samuel Clemens) provides a useful metaphor for crowdsourcing and digitization. Tom turns a boring chore (whitewashing) into something desirable for others to do. What makes the story timeless is that over 144 years later people are still trying to get others to do the work for them. In the realm of digital humanities, transcribing hand written documents or identifying or vectoring shapes, is a tedious and time consuming task. A project with tens of thousands of documents used to take decades to scan, transcribe, and digitize. However, organizations are turning towards crowdsourcing as a way to reduce costs, and speed up the process while creating a community of interest in the project.

People have been participating in crowdsourcing efforts for years without even knowing it. For example, sites that use photo identification or text entry for non-robot identification, leverage the crowd to accomplish some simple digitization tasks. But it is the bigger trend of organizations purposefully creating interfaces to permit the public to contribute to the digitization process that is worthy of review.

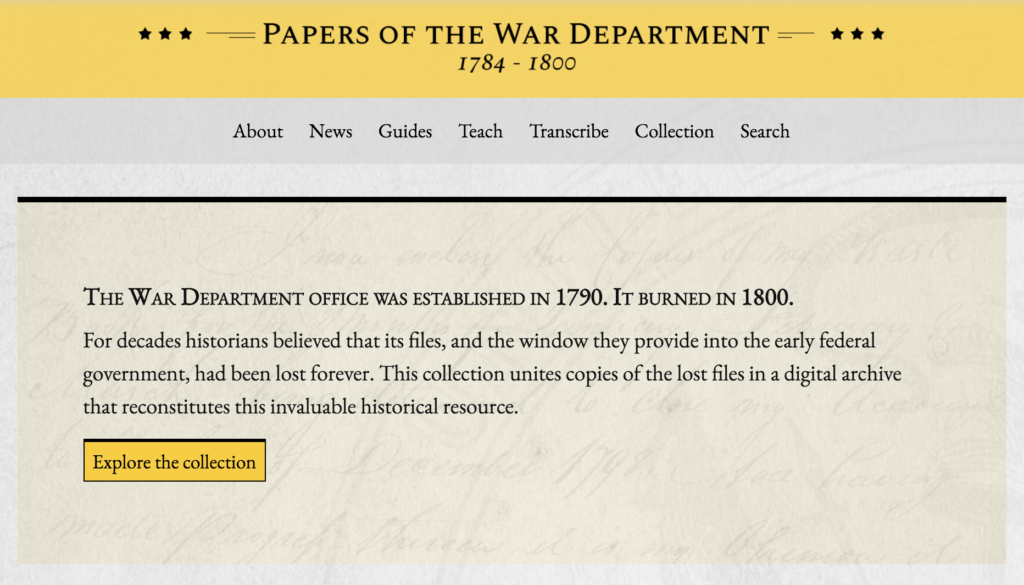
Our crowdsourcing assignment was to review the pros and cons of leveraging public participation in digital collections. It would appear that a growing number of institutions are outsourcing some digitization functions to a public community instead of depending solely on employees. This makes sense considering the sheer drudgery and cost of trying to digitizing large collections. For example, “Papers of the War Department 1784-1800” is a perfect example of how to leverage crowdsourcing to perform correction and transcription contextualization. Currently hosted at the Center for History & New Media at George Mason University, the project’s goal is to restore and make accessible this historic collections of over 42,000 U.S. military records once thought lost in a tragic fire.

Public users accessing the “Papers” site are invited to search, review, and transcribe the remaining hand written documents that need to be digitized. The interface is quite simple and permits users to read a scanned image of the document while attempting to transcribe. In very little time I was able to get familiar with the interface and start transcribing. My only problem had to do with retraining my self to read cursive hand writing from over two hundred years ago.

New York Public Library’s Building Inspector site.

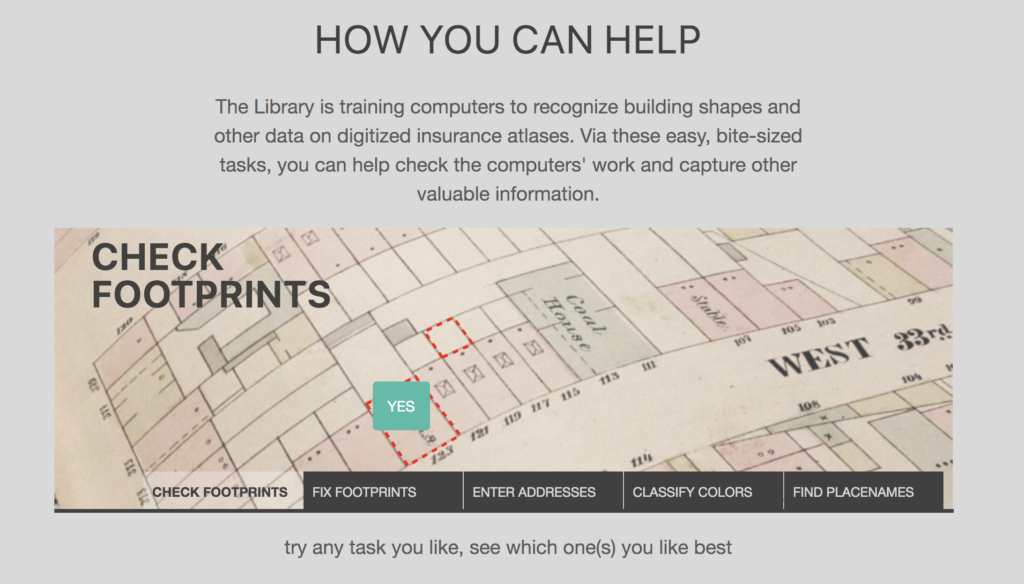
Another example of using crowdsourcing is the New York Public Library’s “Building Inspector” site. This project is a little more whimsical and fun. I think Tom Sawyer would not have had such a hard time getting his friends to participate. In an attempt to gain insight from old New York City inspection maps, the Building Inspector site invites users to assist in vectorization or shape discovery of old buildings outlines. In a rather simple, but addictive process, users have only to visualize an outline of a building and determine if it is correct or not, and whether it needs to be fixed. The reason that humans are better than a machine in reviewing the outlines is our ability to quickly determine if it looks right. A rather mindless activity that even elementary students could participate in. It is a good example of how humans can still do the work of a machine if only enough are willing to provide the time necessary to complete the task.

Of the two examples, Building Inspector is probably a better prototype for the future of crowdsourcing digitization projects. Reviewing building outlines is much more suitable for engaging a bigger crowd. Papers of the War Department requires a more scholarly effort. Transcribing is much more intensive work and I would even say a specialty. The site tries to mitigate that problem by offering various degrees of difficulty for the contributor.

It is clear from this assignment that “contributory” projects are here to stay and will only increase in numbers. As online technologies and interfaces improve more of the public will be able to “interact” or access digital and/or physical artifacts provided by institutions (e.g., providing notes on museums’ objects; tagging on galleries’ digital collection). If the interface and tasks or made to be engaging and interesting, the contributors will come back often and the value of the crowdsource will be self evident. However, if the tasks that the participants are asked to perform are too difficult then the number of contributors will be limited. As with Tom Sawyer, it is not enough to just get someone else to do the work. Eventually, they will want to see what is in it for them.

Categories
Uncategorized

Crowdsourcing

The focus of this blog posting is to determine the pros and cons of using crowdsourced knowledge. Many of us can still remember our parents purchasing encyclopedia sets. They became a valuable resource to complete our homework assignments and book reports. But even then we warned by teachers not to totally depend upon them as a sole resource. So it goes with Wikipedia. As defined in its logo, it is the “free” encyclopedia, and as we all know, you usually get what you pay for.

The concept behind Wikipedia is quite eloquent. Contributors and editors working online attempt to objectively crowdsource in realtime a scholarly article on a particular topic. Since the process is dynamic, knowledge becomes incremental and transformative. Centuries earlier, scholars “crowdsourced” by writing and sharing letters. While a much slower process, this effort did contribute to a period of “enlightenment”. However the problem facing us today, is the process may be too easy and quick. As a result, the veracity or truthfulness of the information may be diminished.

For my class assignment I had to review the Wikipedia site for Digital Humanities https://en.wikipedia.org/wiki/Digital_humanities. The site started in 2006 and provides an interesting perspective as how the field of study has evolved. From my review of the site it took about ten years for the editors and contributors to finally settle on a framework to present their sourced information. During those years it appears there was a lot of back and forth in trying to better define DH and provide better reference material to aspiring students and researchers.

In reviewing the DH site it became obvious that one problem of Wikipedia has to do with the credibility of the contributors or authors. So in essence, a single source or contributor, may not be as credible as the totality of the crowd (multiple sources). On the one hand, Wikipedia is very democratic in permitting a multitude of scholarly viewpoints, but it provides a simple governance process in allowing everyone the ability to edit each other’s contributions. This hopefully keeps everyone on “honest” by making sure they back up their statements with viable scholarly sources. In essence the online equivalent of “prove it.”

Another problem with Wikipedia has to do with the online posturing or confrontations between contributors. While somewhat entertaining, it reflects a 21st century lack of civility driven by our culture’s dependency upon social media. The scholarly process does provide for an “iron striking iron” methodology to craft a final and strong product. But the relative anonymity of social media permits some contributors or editors to exhibit rude behaviors that prevent others from wanting to share information or participate in the exchange.

Finally, according to Roy Rosenzweig, in his article “Can History be Open Source? Wikipedia and the Future of the Past” (2006) its printed guidelines states that it’s primary goal is to “avoid bias.” Wikipedia encourages contributors to write their articles from a neutral point of view, factually and objectively. But even in it’s recommended policies, Wikipedia acknowledges that posting unbiased scholarly research is “difficult” since all articles are edited by people who are “inherently biased.”

So despite Wikipedia’s obvious challenges how should one approach the site and it’s posted articles? First, one should always start at the beginning at look at when the site was created. One of Wikipedia’s great features is that you can time travel and follow the knowledge so to speak. By tracking the posts, edits and contributions you can gain valuable insights as to what were some of the conflicts or controversies that were identified and eventually resolved.

Another guideline is to also evaluate who are making the most contributions. As with most scholarly debates, there are usually only a relatively few subject matter experts attentive to posting and editing. So it is worthwhile to check their biographies if possible. This will go a long way in determining their credibility as a source.

Wikipedia provides a lot of statistics, especially in regard to the volume and pace of editing. This is usually a good point of reference to track and review from a historical perspective. As with most new postings their usually is period of time where both contributors and editors make changes at a substantial volume then it slackens off. This lasts until a new posting somewhat stirs the pot and once again there is some agitation and changes made.

Finally, it is useful to track the “content” menu over time. This provides a valuable insight as to how the “crowd” wants to frame the “knowledge” and information being presented. In

Categories
Digital Humanities Mapping

Comparing Networks and Visualization Tools

There is a growing number of online research tools that are having a significant impact on the field of digital humanities. Easy to use, and accessible, these tools or applications are quite powerful in their ability to permit researchers to sift through large data sets and visualize network relationships. For the past several assignments I was able to test and review three popular tools. These include Voyant, Kepler.gl, and Palladio. While each tool was unique in terms of its interface and original purpose, provided a means to an end. This is an important distinction, especially if one was starting a research project and needed to get a handle on whatever data was available.

For example, Voyant is a “text mining” application that permits the end user to enter large volumes of corpus and visualize text clouds, or tag clouds. This provides a significant capability if one is not clear as to what the text describes or includes. Kepler provides a very specific feature set that allows end users to enter geospatial data and generate a variety of maps. On the other hand, Palladio is much more robust providing several important features such as mapping, graphing, customized lists, as well as a gallery view for images.

While each application on its own provides value, the real lesson for any DH researcher is to be prepared to utilize a variety of tools to visualize and map data. This requires a level of effort to experiment and test each application’s capabilities. Voyant provides the end user a rather straight forward approach to discovering word patterns or hidden terms. Kepler provides a relatively easy way to present physical location data over time. Finally, Palladio permits the end user to visual patterns of relationships. This becomes an important factor when trying define interdependencies in a humanistic study.

As part of my class assignments using the WPA’s Slave Narratives data, the integration of all three tools would be beneficial in analyzing the 1930s research. Voyant could be used to define text patterns of the questions asked and the subjects responses. Kepler could be used to demonstrate that their was a relationship between the physical location of where the interviews were conducted, versus the location of where the enslaved person was from. Finally, Palladio using mapping, graphing, lists, and image gallery, could provide an acceptable interface to explore the final results.

Categories
Digital Humanities

Network Analysis with Palladio

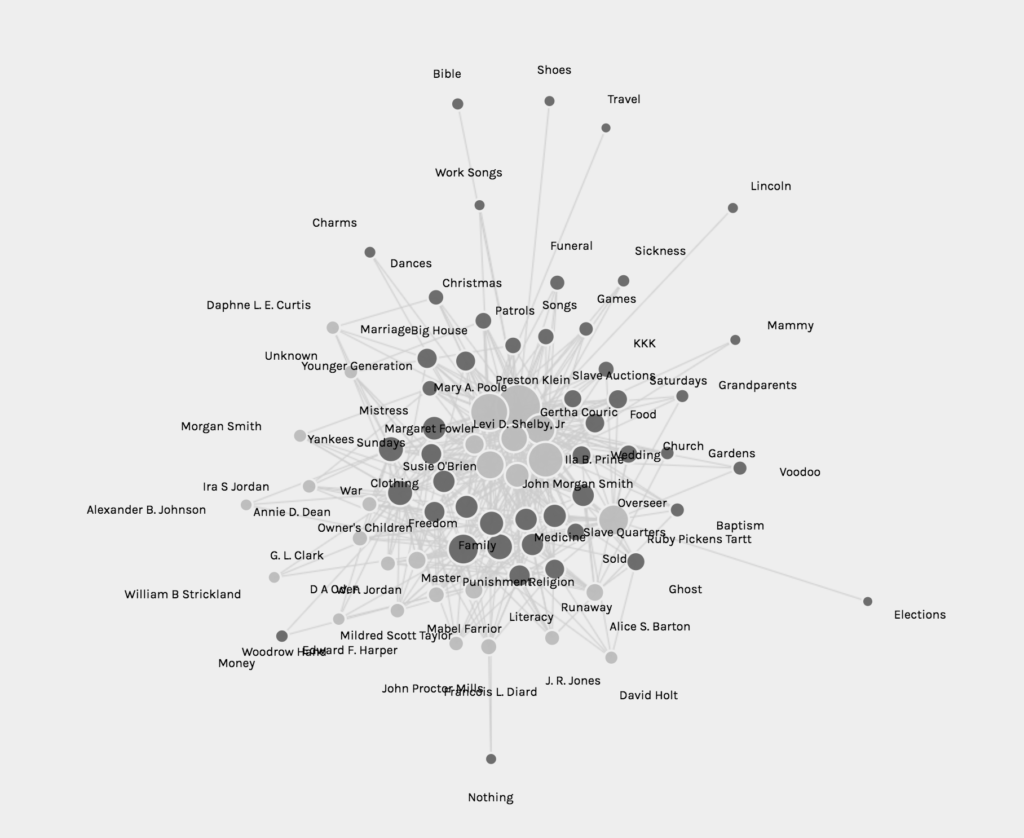
An example of a graph generated by Palladio.

Palladio is a data-driven tool for analyzing network relationships across time. It was created by Stanford University’s Humanities and Design Department. Their goal was to understand how to design graphical interfaces by developing a general-purpose suite of visualization and analytical tools. The basis of their project was the visualization tool prototypes created for the Mapping the Republic of Letters project, which examined the scholarly communities and networks of knowledge during the period 1500-1800.

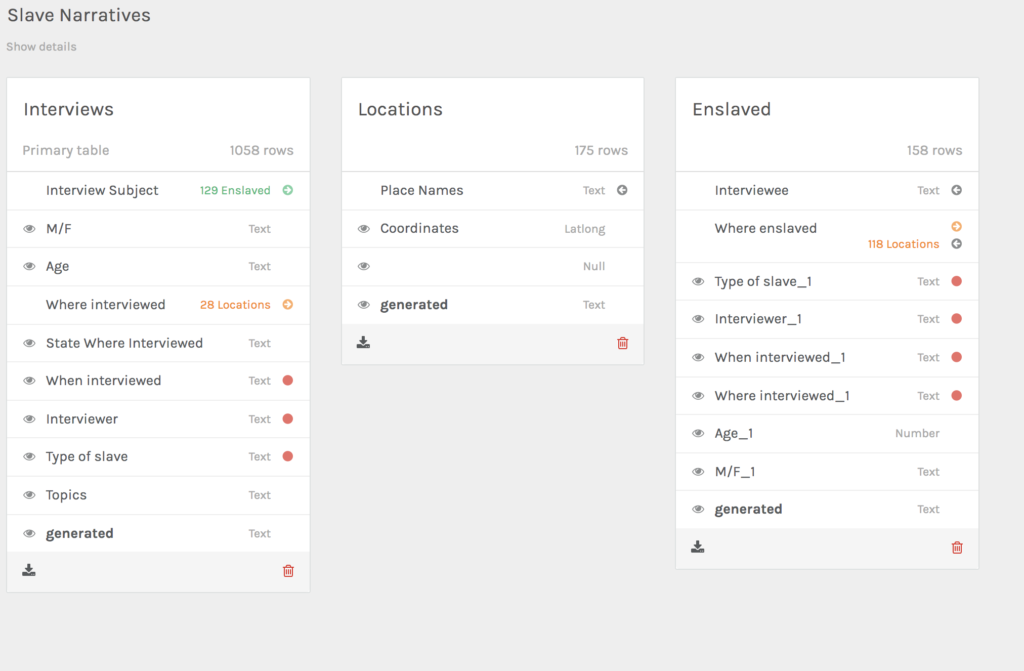
My class assignment was to learn how to use Palladio by leveraging the Alabama state data from the WPA’s Slave Narrative project. In this particular case the lesson plan guided us how to up load the data and create related tables.

The online application was very simple to use and the upload process was quick. With the data uploaded, the exercise was rather straight forward learning how to determine relationships between source and target data.

Based on the original source data, I was able try various combinations. For example I selected source data from the interviewers and target data of the topics discussed. The application automatically generated a graph (shown at the top). From this graph I could start defining network relationships by interpreting the visualizations.

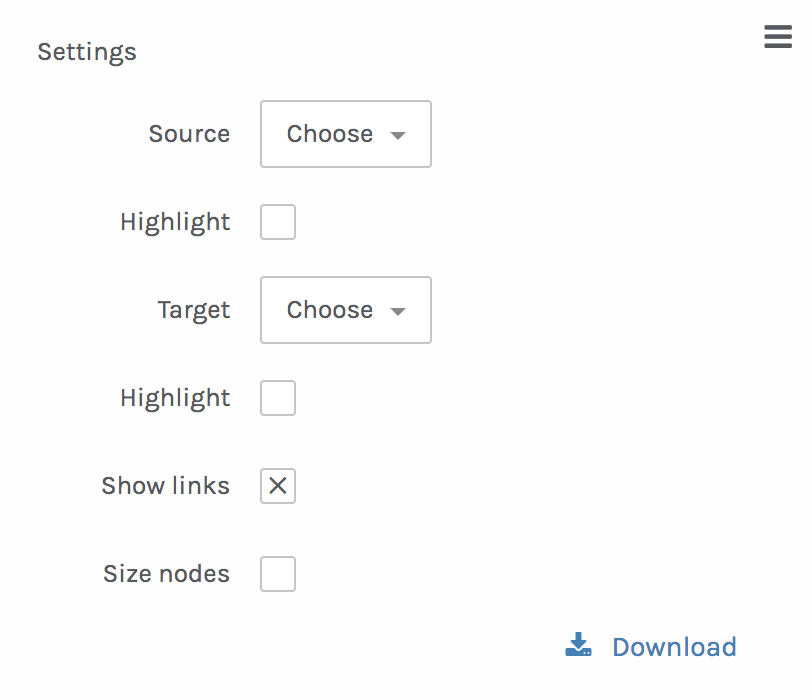
The interface is quite intuitive and permits easy experimentation if you are not satisfied with the initial results. There are a few available adjustments that you can make with the tool to improve the display of the data. An important feature of the graph options is that a user can drag a point or highlight one or another data source to create a dynamic view of the visualization.

If you want to try it for yourself go the following link:

http://hdlab.stanford.edu/palladio/

Categories
Digital Humanities Mapping

Mapping History

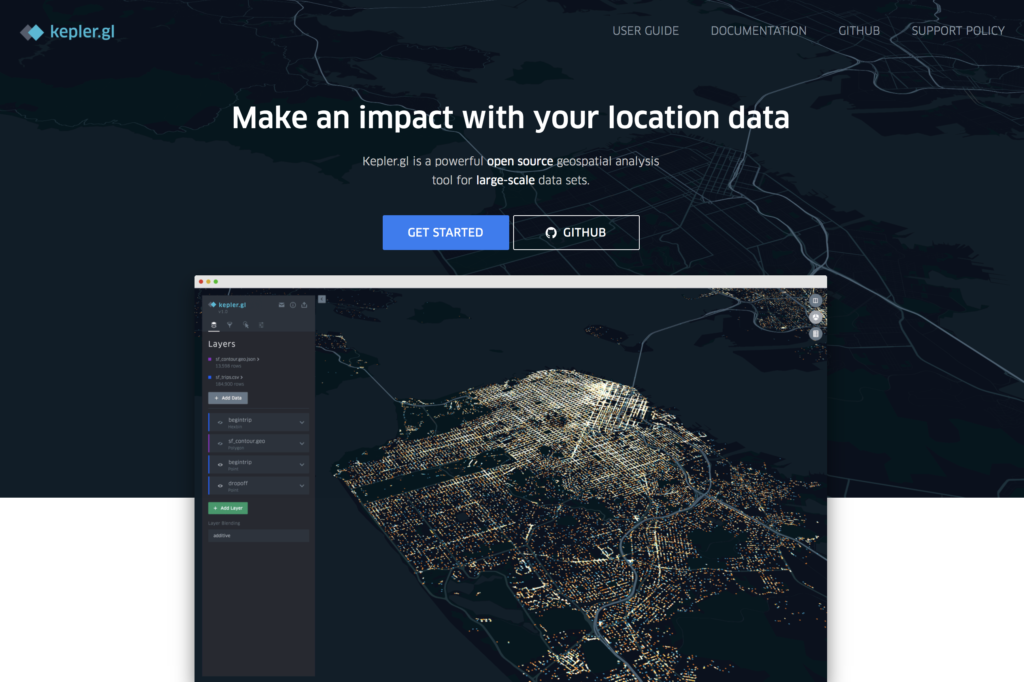
Kepler.gl is a powerful open source geospatial analysis tool for large-scale data sets. In plain english it lets you visualize data by mapping multiple location points and letting the user use both time and distance as a means to tell a story. The system is designed for both technical and non-technical users. The key is to learn how to use the available filters to visualize the insights that you what users to explore.

The Kepler.gl workflow is based on data layers that permit the creator to present a variety of visualizations including “points”, “lines”, “arcs” and even a “heatmap”. Kepler provides a variety of map styles, color palettes, and map settings. Like most well thought out applications, users need to only spend a little time getting familiar with the interface. It is highly recommended to start with a small project to get better acquainted with Kepler’s unique and very useful features.

For my class assignment we used mapping data collected during the 1930s Works Progress Administration (WPA) Slave Narrative Collection. From 1936 to 1938 the Federal Writers’ Project undertook a major initiative to compile the histories of former slaves living in seventeen states. I was able to use data gathered in the state of Alabama. The map data displayed below shows the relationship of where the subject was interviewed and where they were originally enslaved.

Recent technologies like Kepler Gl. will provide researchers a whole new way of using maps to visualize large collections. The fact that I was able to bring alive dormant data that had been stored somewhere for over 70 years is impressive. But the key to a successful project will be obtaining consistent and accurate mapping data.

Categories
Digital Humanities Sources for Finding Digital Data

Mining for Text

For thousands of years humans have understand the power of the written word. As a result great care was given to preserving books and other written documents. But in the digital age we live in there is a desperate need to be able to sift through the ever growing volumes of generated text. Fortunately for us new information technologies are available to us average folk that enable us to mine digital text.

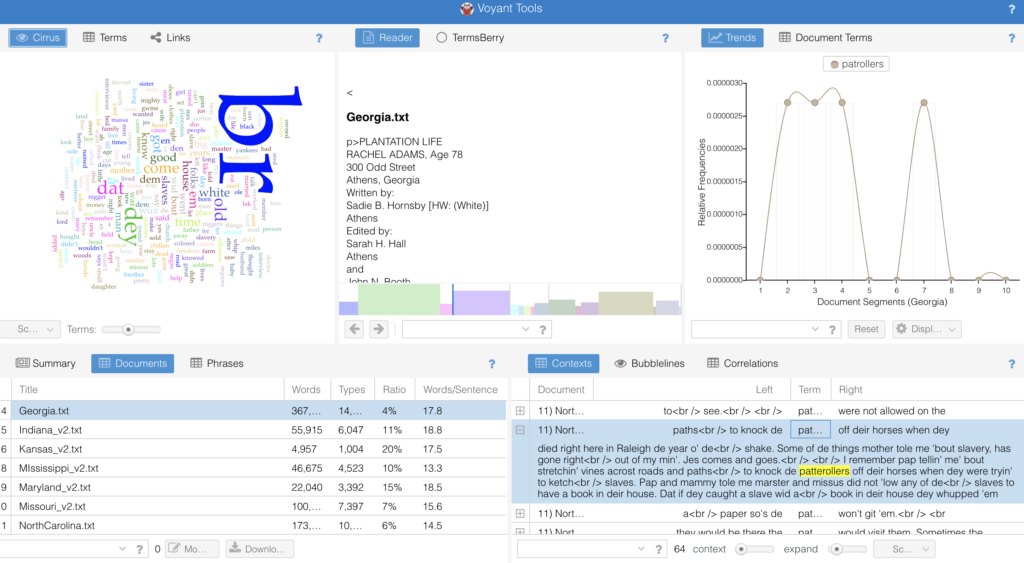
Recently I was able to test drive an application called “Voyant”. On their website they describe themselves as a web-based reading and analysis environment for digital text. For us digital historians Voyant is an inexpensive was to explore the world of text mining. As with all things digital, not everything is as simple as it looks. Voyant is no different. In text mining projects involving large corpus there is both a pro and con to how to proceed. What makes Voyant incredibly powerful is its intuitive user interface and visual displays. Unfortunately the user needs to understand the basics of text mining. For example, there needs to be some familiarity with concepts such as vocabulary density, frequency, and distinctiveness. Also, mining operation has to distinguish between the overall findings for the corpus or collection, versus the unique findings that can be found in an individual document.

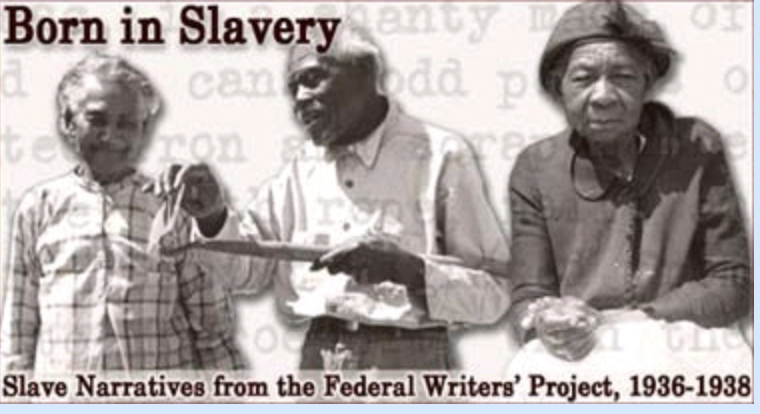
For my class we were assigned to use a rather interesting text collection called the “WPA Slave Narratives“. It was a Works Progress Administration project from the Great Depression, where writers set out to gather and capture the stories of formerly enslaved people. As a historical collection it is a fascinating look back in time. The writers collected testimony from 2.300 people across 17 states. it includes over 9,500 pages. In the past trying to conduct a text mining project of this size would have been insurmountable. But the moment the original collection was scanned and digitized the narratives became a valuable resource. A quick search online revealed that dozens of books have been written using the collection.

The slave narratives was an excellent case study to try to work through how one can leverage text mining. The nature of the original project back in the 1930s never intended to be “mined” digitally. But what I learned is that in the writer’s attempt to record the narratives as authentically as possible, they also captured the interviewees variances of local dialect, poor grammar, and faded memories. As a result. the entire corpus reflects a unique challenge to sort through digitally today.

The value of using an application such as Voyant can not be minimized. It really helped identify the variations in word usage through the text cloud, but it was the other available functionalities, ie: reading, trends, context, and summary tools that provided a way to identify thematically similar information across the corpus. I highly recommend getting started using Voyant, but be prepared to navigate through a new way of thinking about how words are related, and how they need to be extracted to gain better insight or value.

Categories
Digital Humanities Metadata

Why Metadata Matters

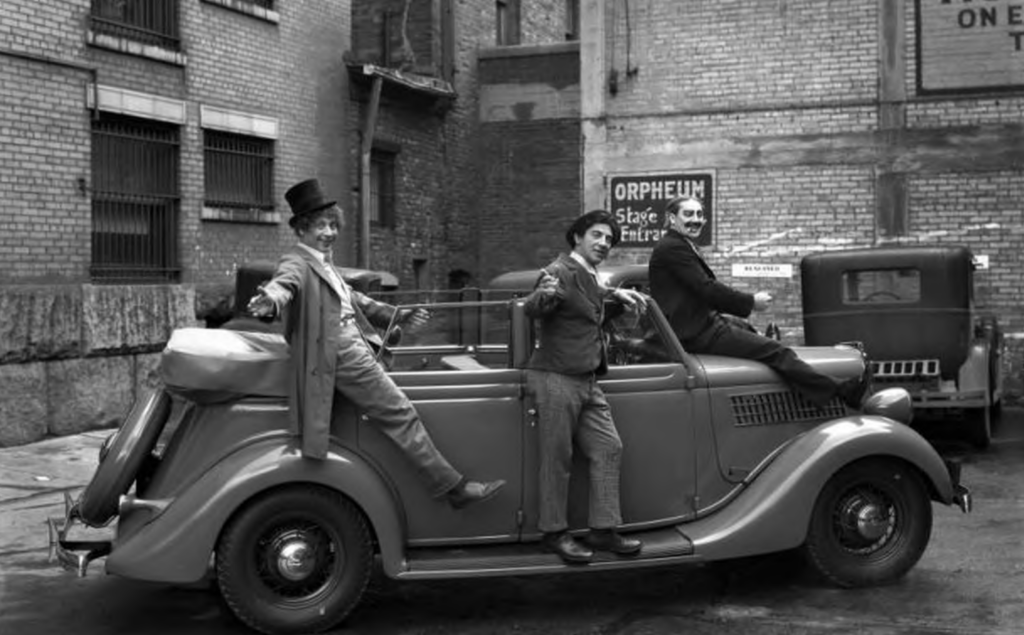
“If you are not having fun you are doing something wrong.” Groucho Marx

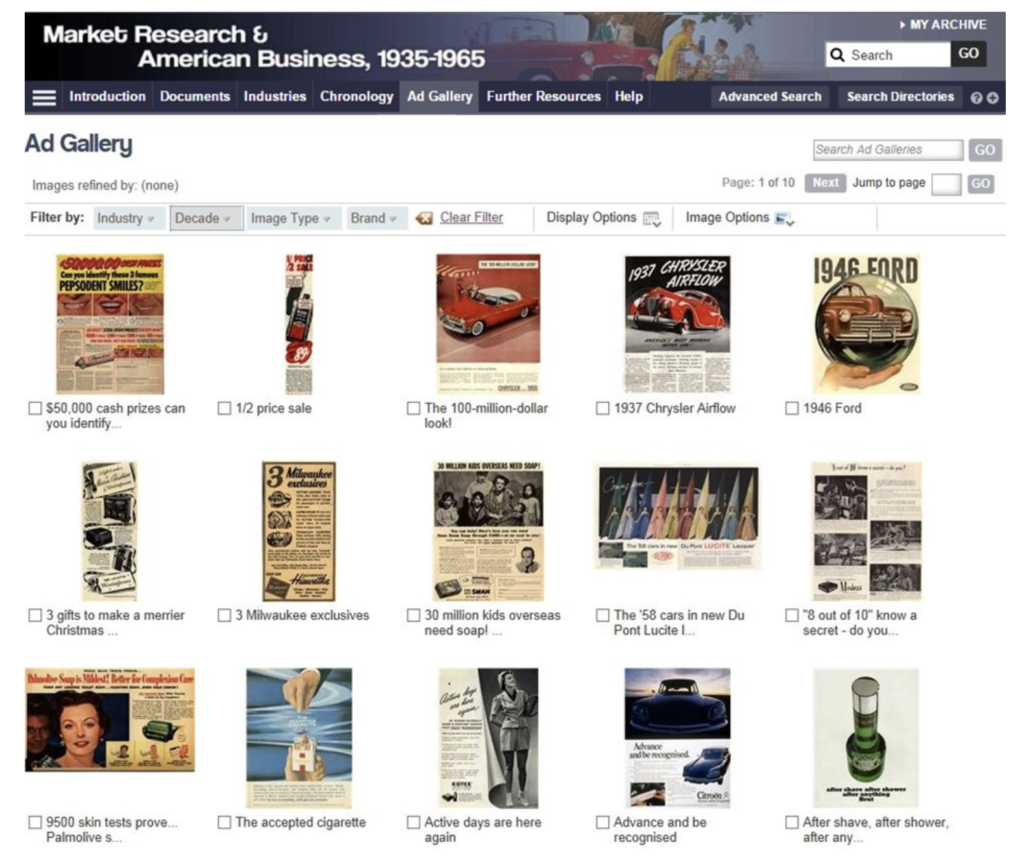
For a previous class assignment I reviewed the “Market Research & American Business, 1935 -1965” digital collection.  The site provides a wealth of information regarding America’s consumer culture. One notable feature of the collection is how well it incorporates metadata in its search features. Unlike a search engine site which encompasses a broad and wide range of objects, digital collections by their very nature, are more narrow in scope. They can be more surgical in their use of key words and metadata.

We know that metadata is descriptive information that assists users in looking for digital objects like images, documents, and media files. But not all online collections use metadata consistently. When properly applied metadata ensures a higher degree of success in making digital objects discoverable. This is due to the fact metadata helps users create associations or relationships between objects. As a result they can use the choices of metadata to ask relevant questions and get the search results they need. However, more often than not, valuable information stored in collections go undiscovered. This is due to the poor use of metadata and user frustration with search results.

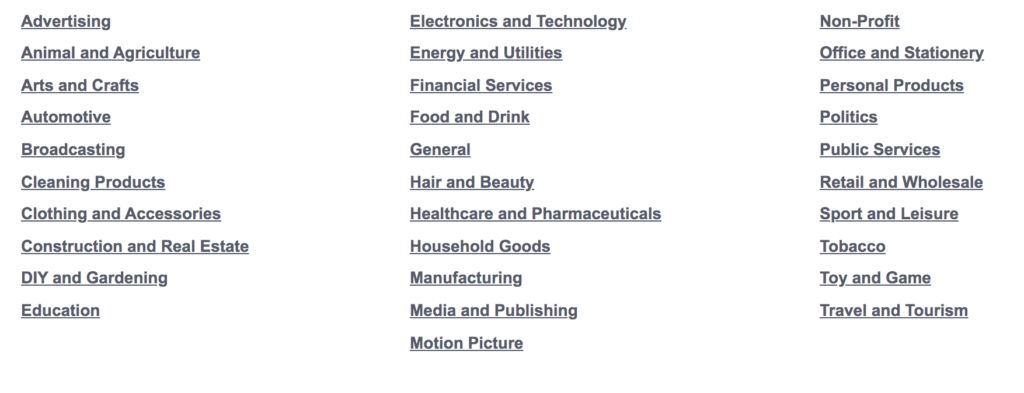
Market Research & American Business is a good example of how to properly describe a collection’s available content through its navigation options and metadata. Users are provided several ways to search for objects. This includes well defined directories and a useful “glossary” page that presents a extensive list of key words that can be applied to advanced searches.

The collection focuses on both marketing research and studies (documents) as well as the images of the advertisements from the 1935 – 1965 period. The metadata associated with the collection’s objects provides the user a good overview of the era’s brands and companies as well as the industries they serviced. What makes the collection unique is the discoverable research that provides a behind the scenes vantage point of the psychology behind the major American marketing campaigns of the era. 

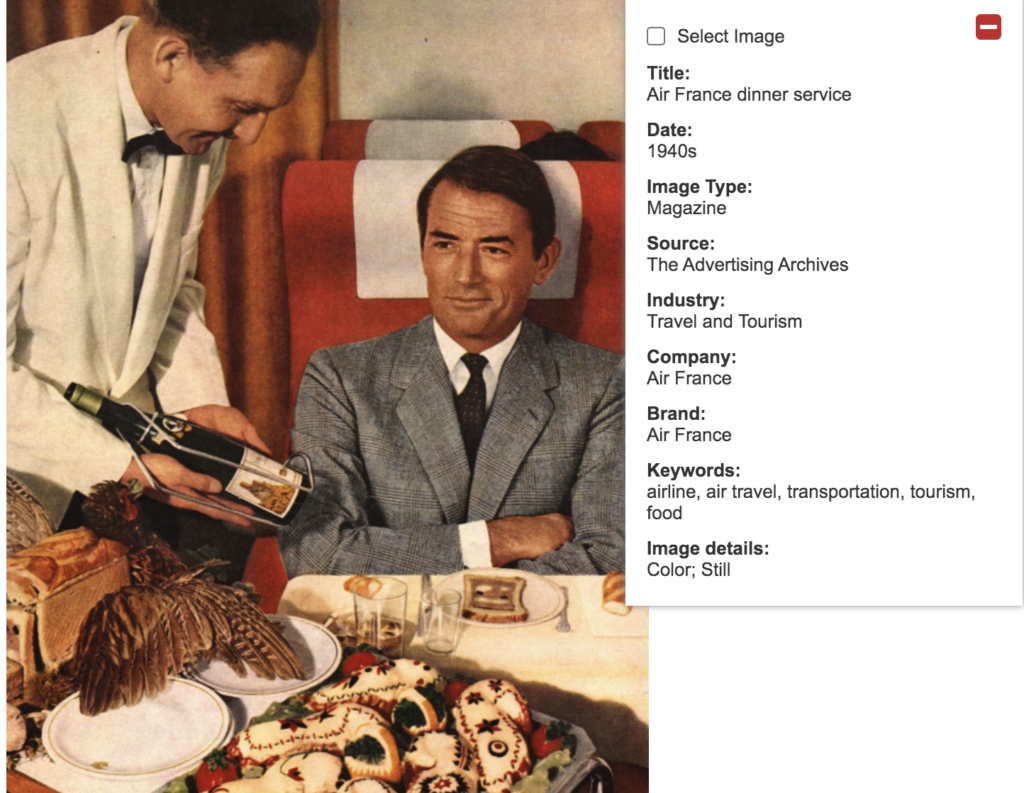
1940’s advertisement for Air France

However, the site’s features and metadata does not easily provide identifiable information on the types of studies conducted or the intended audiences response to the specific advertisements and campaigns. This would be a valuable resource that would permit future researchers to study the effectiveness of marketing during this period.

For researchers using the collection, the site’s application of metadata and search functions permits some interesting questions to be asked. For example, the availability of consumer research by industry permits questions to be raised on what impact did variables such as sex, or race, of the intended audience have on how they responded to certain brands or product purchased. Also, the three decades of available digital objects, allows a user to track significant trends in the changing marketing styles of the era (tail fins on 1950s automobiles).

Unfortunately the site is limited in scope to only three decades of research and the collection of one marketing expert, Ernest Dichter. While the collection is a significant glimpse into how Americans were persuaded to purchase and consume, it does not provide a complete catalog of available objects during the period. As a result the site’s metadata does not allow you to ask some very obvious questions. For example were American consumers really oblivious to being manipulated during those decades? As consumers, are we any different today?

Categories
Databases Digital Humanities

A review of the “Market Research and American Business,” 1935-1965 Database

Overview:
Lying beneath the surface of the popular search engines we use are countless data collections or public databases.  These collections carefully gathered and maintained, provide a valuable resource for digital historians.  However, not all of these databases are the same.  Some are intuitively designed and assist with searches, while others may be full of useful data but are difficult to navigate.   

An example of a well thought out collection is the “Market Research and American Business,” 1935-1965 Database.  According to site’s introduction page:

“The collection provides a unique insight into the American consumer boom of the mid-20th century through access to the market research reports and supporting documents of Ernest Dichter; the era’s foremost consumer analyst and market research pioneer.”

The collection is also a valuable time capsule by providing access to information on some of America’s best-known brands.  It contains thousands of reports commissioned by advertising agencies and global businesses in a booming era for consumerism, ‘Madison Avenue’ advertising and global brands on consumer goods ranging from tobacco and broadcasting to cars and hotels.

But most important the database provides a behind the scenes vantage point of the psychology behind the major American marketing campaigns of the era.  The site’s wide variety of available research provides an interesting perspective of America’s consumer culture.

The site provides three ways to search.  A basic text search option.  An advanced search that includes keywords, text, along with a proximity option.  Finally, there is a rather thought out search directory that provides several options including pre-determined lists of keywords, companies, and brands.  I found that the search was intuitive and very responsive. 

The Market Research and American Business collection provides access to data objects from 1935 – 1965.  It includes access to three primary advertising and marketing collections.  These include the Hagley Museum and Library; the John W. Hartman Center for Sales, Advertising & Marketing History; and the Advertising Archives. Users are able to download a wide range of research documentation, including studies and proposals, as well as high resolution PDF’s of original published advertisements.

Access:
In regard to “terms of use” and access, the site is primarily for education and research purposes.  There are specific sated restrictions, especially since the material concerns some well known brands.  There is a detailed FAQ page that provides clear instructions for educators on fair use of the material, including how to cite documents, and what can be downloaded and copied.

In addition, Market Research and American Business has a well written introduction to the collection and provides a very helpful “Page by Page guide” as well as offers users to “Take a Tour.”  It goes into sufficient detail for first time users on how to get started, review of resources, and how to conduct searches.  Finally, there is an “Editor’s Choice” that provides users with some whimsical postings when Madison Avenue was in its heyday.

Document highlights include topics as:
Why women buy
How to get more people to go to the movies
Attitudes and motivations of the American voter
Cigarette advertising: the untapped possibilities – a creative memorandum on the psychology of smoking
A motivational research study of the Negro market for Esso gasoline, services and related products
Creative research memorandum on the psychology of hot dogs
A creative memorandum on psychological advertising of toys to parents
Cigarette smoking among women
Sexual attitudes in the United Kingdom – today
Marketing Chrysler automobiles in a rapidly changing society
The role of supermarkets in our modern culture
A pilot study on the Bird’s Eye logo

The Advertising Archives Material Types:
Reports
Proposals
Case studies
Surveys
Questionnaires
Correspondence
Memorandums
Pilot Studies

Subjects:
Advertising
Consumerism
History
Psychology
Gender/Women’s Studies
Media

Reviews:
A search of online reviews found several articles that support the author’s conclusion that the Market Research and American Business collection is well organized and supports research efforts to study America’s consumer culture.  For example a review form the University of Delaware’s Library, Museums and Press states that the site provides “valuable insights,” and that it is “highly recommended for students at all levels,” and “a unique perspective into the world of buying, selling, and advertising in pre-and post-war America.”

Conclusion:
Market Research and American Business collection sets the bar very high as a database resource. It is purposeful in trying to help researchers get access to the material that they are looking for as quickly as possible . In addition, it goes out of its way in instructing users how to best leverage and the collection assets by utilizing the available search options. Finally, the advertisements and the psychology behind them makes for a compelling story.

Categories
Digital Humanities

Everything but the kitchen sink.

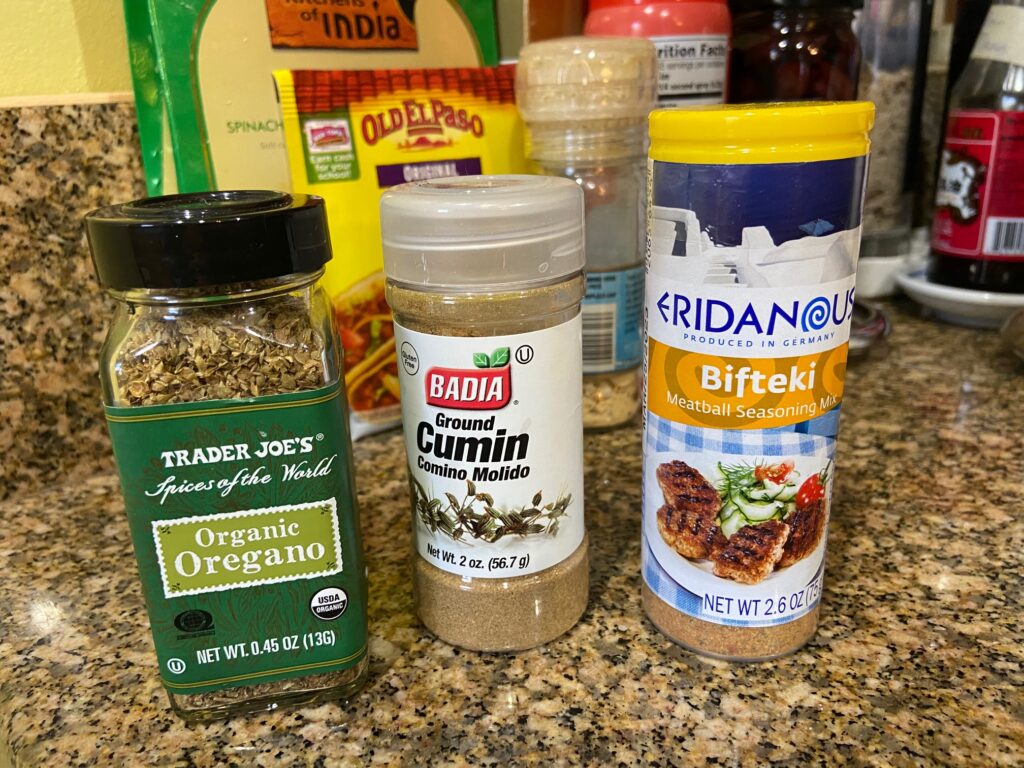
Does a picture really speak a thousand words? Some of the author’s kitchen condiments.

The assignment was to take still images and videos of some of the objects in my kitchen. It was part of a lesson module to teach my graduate class about digitization. We take it for granted today, but every time you use your smart phone to take a picture or video you are “digitizing” something. This process captures a significant amount of information and for the most part can easily be shared. However, it becomes self-evident that every image or video is subjective in the eye of the beholder as to the information it conveys.

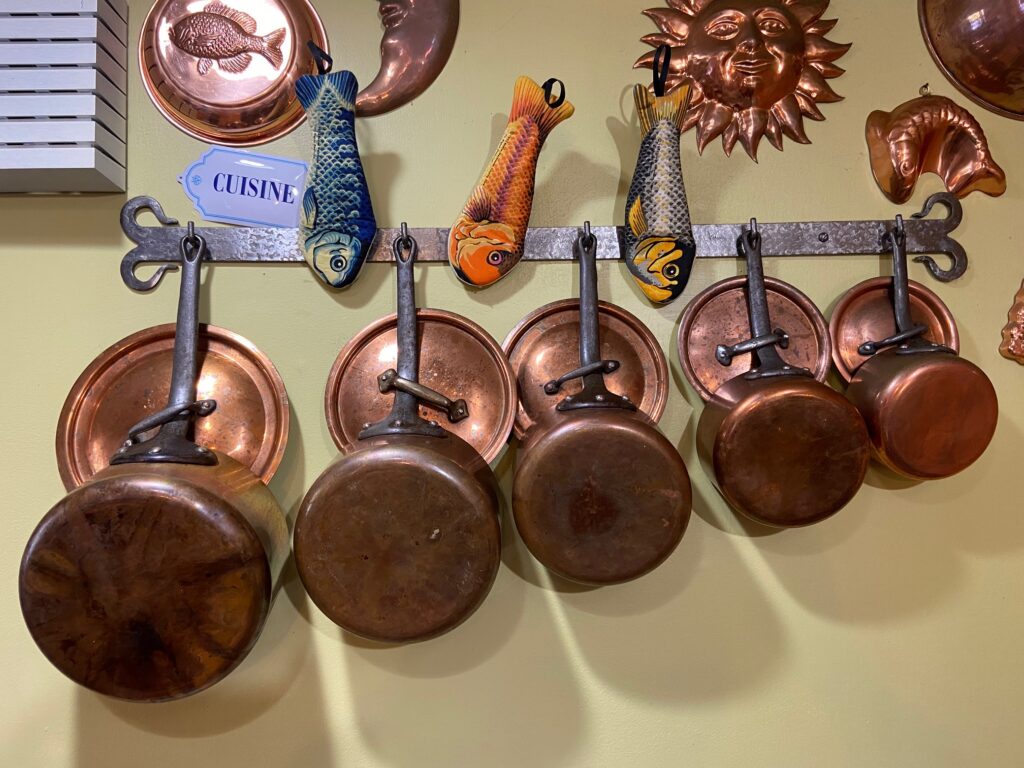
French copper pots

For example, the image above of the French copper pots does not do justice to the wonderful meals that they have been used to prepare over the years. It also does not convey the tedious work required to shine them up. A cooking video would be more appropriate. So how you capture or digitize an item is really part of the story you want to tell.

According to Melissa Terras, “Digitisation and Digital Resources in the Humanities” (2008) anything that is visible is capable of being digitized. She believes that this process “creates the core content for a digital resource.” Marlene Manoff, in her 2006 abstract “The Materiality of Digital Collections: Theoretical and Historical Perspectives,” points out that every object has “material characteristics.” These characteristics, like size, color, shape, texture, usually can be captured in a digital image. But some characteristics like smell, or sound can not be capture with an image. While sound can be captured with a video, smell-o-vision is still not a reality. As result, the accompanying textual content included with an image plays an important role in establishing the object’s informative value. By supplementing the obvious visual data, more detailed characteristics of an object can be preserved.

Manoff believes that the end result of all this digitization is a “content management” process. A process that has become more personalized as everyone must now learn how to manage their digital collections. In the past, managing the capture of multimedia was dependent upon the manual entry of associated descriptive text or meta data. However, the growing utility of cognitive services like facial recognition, and transcribing, are rapidly automating this process.

Paul Conway, in his 2009 paper “Building Meaning in Digitized Photographs,” points out that more and more cultural heritage organizations are recognizing the need to leverage Image Digital Archives (IDA). He adds that the digitization process is adding value to these organization’s archives by creating “digital” surrogates. But Conway also acknowledges that a digital file of an archived photographic print is still just a representation of the original artifact. Well known institutions like the Library of Congress have become the standard in providing researchers access to a variety of file formats and image resolutions. This provides researchers the ability to determine the level of detail they require.

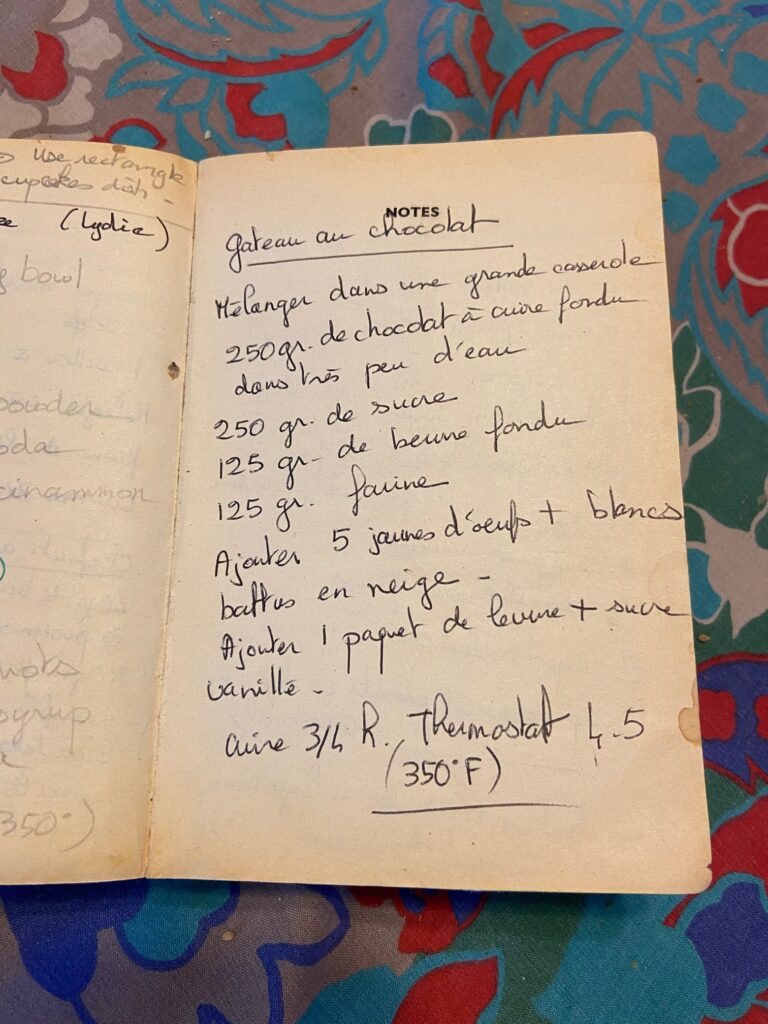
French recipe for chocolate cake

So as a lesson learned the “kitchen digitization” project was useful in determining the broad scope of things that can be digitized, and in what format. One of the assigned items to digitize was a recipe. Shown above is my wife’s family recipe for “Gateau au Chocolat” or chocolate cake. I’m not sure it is a secret, but tasting this cake for the first time probably had something to do with our getting married. But in regard to digitization, just a digital image of the recipe may not have been enough. For those that do not understand French, but are eager to taste this wonderful cake, a translation would be helpful.

Finally, in the field of digital humanities, the creation of these so called “digitized representations” is part of a bigger debate. Are these new surrogates worthy of their own study and should everyone be encouraged to use them as unique objects in their own right?. For me, the issue comes down to accessibility. Having online access to countless numbers of digitized photographs is a tremendous resource. Especially in this time of Covid 19. There is no doubt that in an age of social distancing the need to capture and make public cultural heritage archives is becoming very compelling. Especially if these institutions want to maintain their relevance.

css.php